
Tags: FinOps Azure Databricks DevOps
The problem
Every month, your Databricks platform produces two bills. Azure invoices the virtual machines, local SSDs, premium storage, and network egress your clusters run on, while Databricks meters DBU consumption in its own system tables. The number everyone actually wants, the true cost of a single workload, exists in neither.
So teams do what teams always do: they export both datasets to Excel and reconcile them by hand. It is slow, it is error-prone, and it has to be redone every month because hyperscalers restate billing data retroactively. Within IT Financial Management (ITFM), a core discipline of Technology Business Management, this pattern has a name: IT leaders describe spending the bulk of their time as data janitors , cleansing and reconciling raw billing records instead of analyzing them.
There is a better way, and it does not require buying another platform. In this post we walk through a FinOps MVP we built for our clients: a pipeline running on Azure Databricks itself that ingests both billing streams and merges them into a single cost lakehouse in the FOCUS format. We cover the raw data formats, the join keys, the traps, and what the finished product looks like for the business.
What is FOCUS?
The FinOps Open Cost and Usage Specification (FOCUS) is an open standard from the
FinOps Foundation
that defines one common schema for cost and usage data across vendors. Instead of maintaining bespoke mappings for
every provider’s billing export, you get pre-conformed columns such as BilledCost, EffectiveCost,
ChargePeriodStart, and ResourceId with identical semantics everywhere.
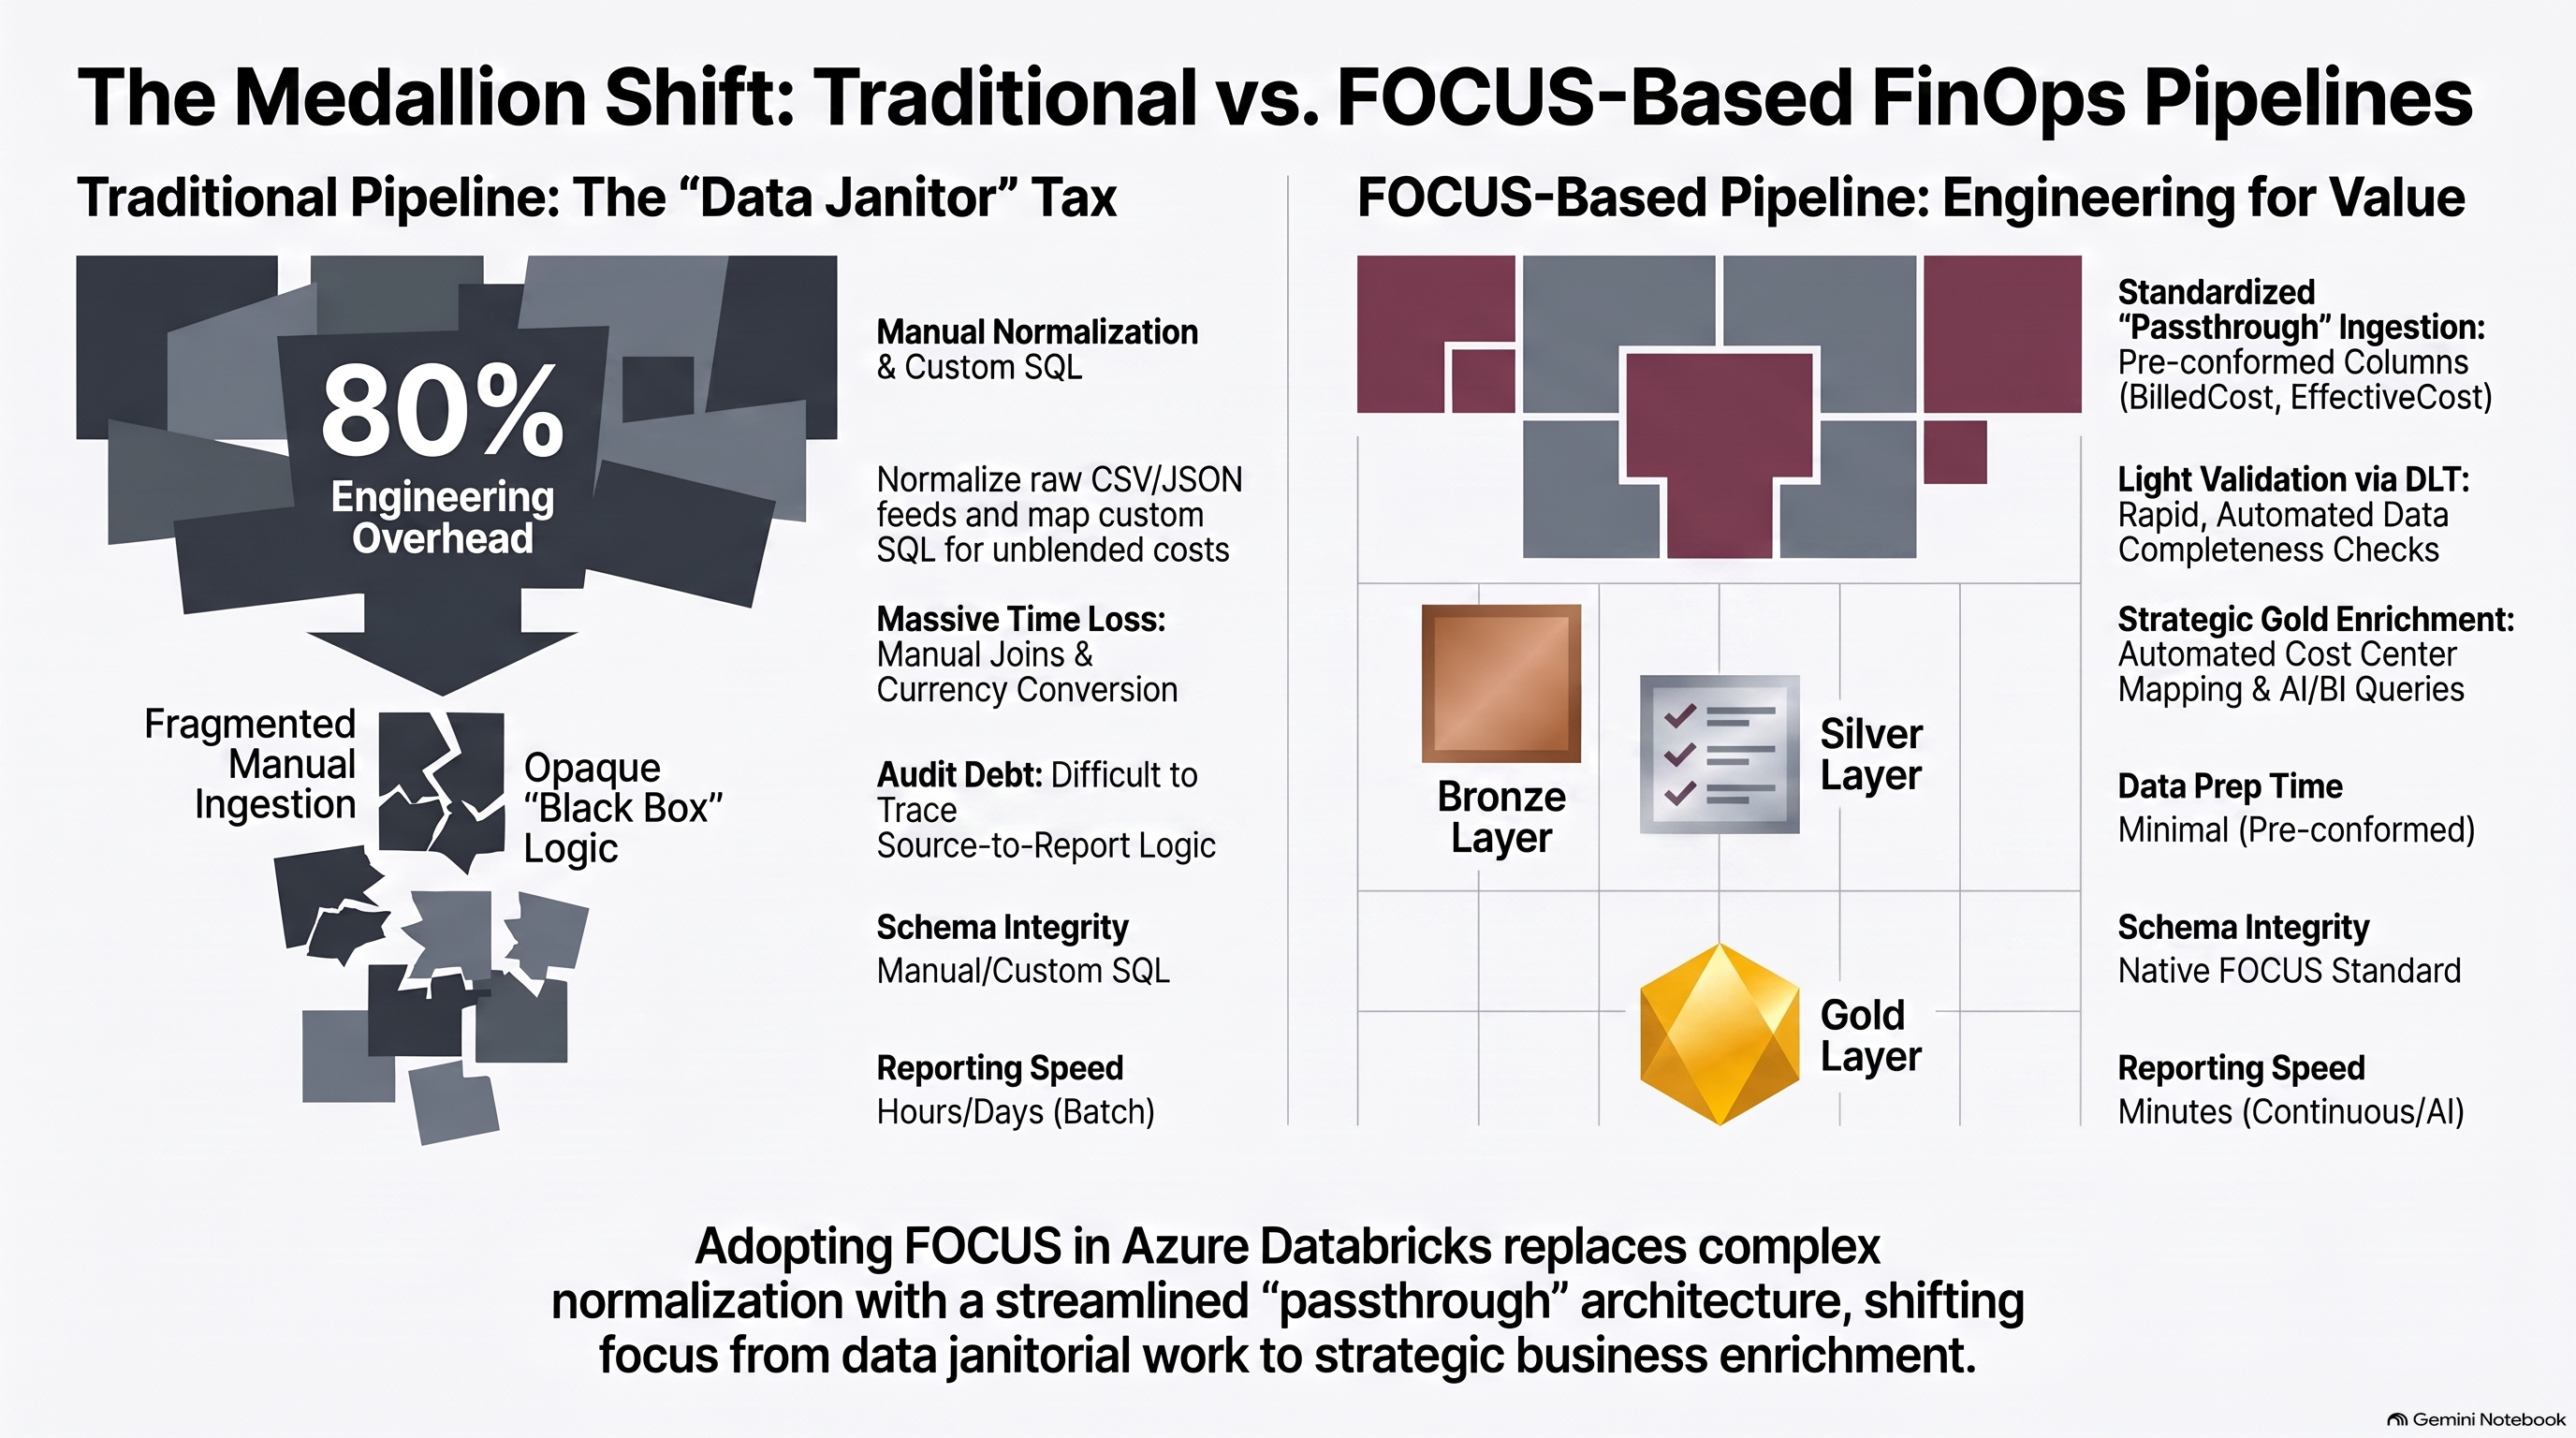
For a merging pipeline, that changes the shape of the work. The pipeline no longer spends its cycles renaming vendor columns and guessing at their meaning. Validation becomes light, and the engineering effort moves to where it earns money: joining, enriching, and serving the data (Picture 1).
Two billing streams
Azure infrastructure costs: native FOCUS exports to ADLS Gen2
The Azure side is the easy half. Azure Cost Management supports scheduled exports of cost datasets directly to an ADLS Gen2 storage account, and one of the supported output formats is the native Cost and Usage Details (FOCUS) dataset. This stream captures everything Databricks compute consumes underneath: the VMs, the disks, and the networking. You configure it once and FOCUS-shaped files land in your storage daily.
Databricks DBUs: system tables that don’t speak FOCUS
The Databricks side needs work. Platform consumption is exposed through
system tables
, primarily system.billing.usage and system.billing.list_prices. They are granular and reliable, but they do not
conform to FOCUS out of the box. They expose raw hourly usage records, DBU rates, and region-specific SKUs in a
Databricks-native schema.
The MVP therefore runs a scheduled SQL transformation that maps the system tables into FOCUS columns. Databricks publishes a system tables to FOCUS 1.3 query that we use as the starting point. The core of the mapping looks like this:
| Databricks source | FOCUS column | Transformation |
|---|---|---|
usage_start_time / usage_end_time | ChargePeriodStart / ChargePeriodEnd | Truncate to YYYY-MM-DDTHH:MM:SSZ, drop optional milliseconds |
usage_quantity joined to list_prices | EffectiveCost | Join on SKU and price validity window, multiply quantity by rate |
billing_origin_product | ServiceName | Map product codes (JOBS, SQL, DLT) to readable service names |
usage_metadata.cluster_id | ResourceId | Normalize to match the tag values Azure records on the VMs |
sku_name | SkuId | Pass through, keep the region prefix |
The timestamp row matters more than it looks. The FOCUS spec mandates second-level precision (YYYY-MM-DDTHH:mm:ssZ), but Databricks system tables emit millisecond-precision timestamps, so the transform truncates them before the two streams ever meet. Skipping this step is the single most
common cause of silent ingestion failures we see.
Building the pipeline
With both streams defined, the Data Engineer’s job is making two billing sources that have never heard of each other talk inside one lakehouse. Databricks documents the overall approach in its cloud infrastructure costs field solution , and the write-up Getting the Full Picture explains why the merge is worth the effort. Here is what actually consumes the engineering time.
Streaming ingestion with Auto Loader
Auto Loader streams the raw Azure FOCUS files (Parquet or CSV) from ADLS Gen2 into a Bronze Delta table as they arrive. Bronze keeps the files byte-for-byte, which preserves auditability: when Finance asks why a March number changed in May, you can show them the exact source records.
The join-key problem: finding ClusterId in Azure tags
Tags are the join keys. Azure bills at the resource level, so a VM row knows its resource group and its tags;
Databricks bills at the cluster level, so a usage row knows only its cluster_id and workspace. Neither side
references the other directly.
Azure Databricks injects ClusterId and WorkspaceId tags into every VM it provisions, so the
pipeline parses the high-cardinality Tags column of the Azure stream and extracts both values. Two caveats
from production: tag propagation can lag resource creation by a few minutes, and resources created outside the
Databricks control plane (jump boxes, self-managed storage) carry no such tags. Plan an “unmatched” bucket for both
cases instead of pretending they will not happen.
Timezone and grain misalignment
Azure FOCUS exports are aggregated and refreshed daily. Databricks system tables record usage hourly. Joining them
naively multiplies rows and inflates costs, so the pipeline truncates Databricks timestamps to a usage_date day
grain before the merge. You lose intra-day resolution in the unified table, and that is an acceptable trade-off for
an MVP; the hourly detail stays queryable in the Databricks-side Silver table.
Serverless vs. classic compute: avoiding double-counting
Mixing up how serverless and classic compute are billed is the logic error that quietly ruins unified cost tables. For classic compute, Azure bills the VMs directly, so a cluster’s true cost is DBUs plus the matched infrastructure rows. For serverless compute, Databricks manages the VMs and bundles them into the DBU price, so the same addition counts the hardware twice.
The ETL must branch on the billing origin: match and add infrastructure costs for classic workloads, take the DBU cost as complete for serverless ones (storage stays separate in both models). Get this wrong in either direction and you ship dashboards that are confidently incorrect.
Retroactive billing adjustments and MERGE INTO
Hyperscalers reprocess billing data throughout the month, so yesterday’s rows are not immutable facts. Appending every refresh creates duplicates; the pipeline upserts instead:
MERGE INTO silver.unified_costs AS t
USING staging_focus_updates AS s
  ON  t.ChargePeriodStart = s.ChargePeriodStart
  AND t.ResourceId        = s.ResourceId
  AND t.SkuId             = s.SkuId
WHEN MATCHED THEN UPDATE SET *
WHEN NOT MATCHED THEN INSERT *
Delta Lake’s MERGE INTO keeps the table idempotent across restatements, and time travel preserves the audit trail of
what changed and when.
From costs to accountability
A merged FOCUS table is an engineering artifact. The Data Analyst turns it into something a CFO will act on.
Translating cloud-speak into cost centers
db-cluster-101 means nothing to Finance. The analyst joins the unified table with HR and CMDB data to attach
team_owner, cost_center, and business_unit to every row. This enrichment happens in the Gold layer, and it is
what makes showback and chargeback possible at all.
TCO dashboards that don’t double-count
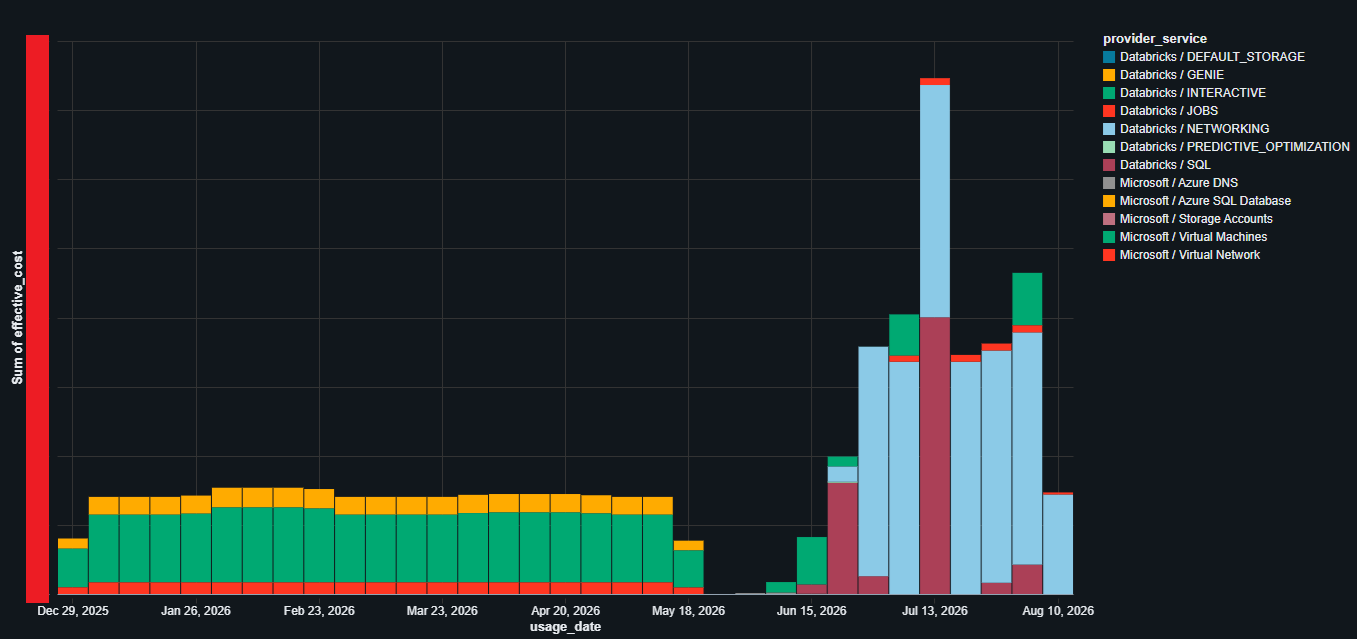
The Gold table feeds dashboards that show total cost of ownership per workspace, workload, and business unit, with VM infrastructure, storage, and DBU costs kept as separate, stackable components. Keeping the components separate is what lets a team see that its batch jobs run on All-Purpose clusters at roughly double the DBU rate of Jobs Compute, and act on it, without anyone misreading a blended rate (Picture 2).
Natural-language cost queries with AI/BI Genie
Because the Gold table lives in Unity Catalog, exposing it to AI/BI Genie takes minutes. Business leaders then ask questions like “what did the IoT pipeline cost us last month, platform and infrastructure combined?” in plain English, without filing a ticket for a new dashboard. The quality of the answers depends directly on the quality of the enrichment step above, which is a polite way of saying Genie will not save you from skipping it.
Native cost visibility within Databricks Governance Hub
While the custom FOCUS pipeline gives you the full picture, Databricks also ships a built-in cost surface worth mentioning. The Governance Hub is a centralized, account-level UI that appears under Governance in the account console. It is currently in Beta and must be enabled by an account admin from the Previews page.
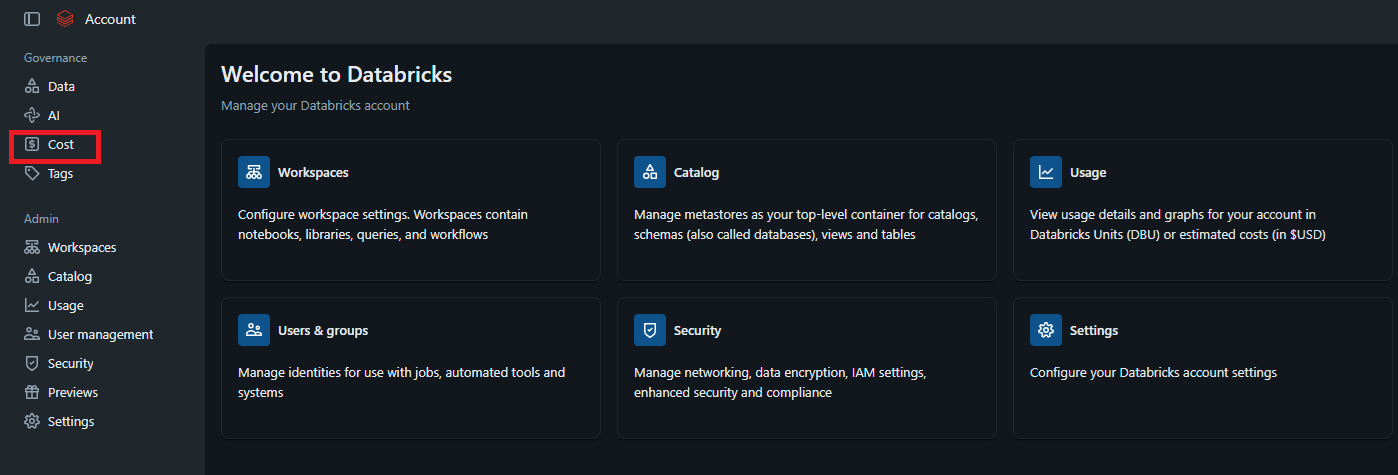
The Cost page inside Governance Hub is the most relevant for a FinOps team. It shows total and month-to-date DBU spend, average daily spend, and a 30-day trend chart. The Top groups tile lists the highest-cost products and workspaces, with drill-down into individual resources: clusters, DLT pipelines, jobs, and SQL warehouses.
Tagged spend shows the percentage of spend carrying tags, with a one-click filter to surface the untagged resources missing cost attribution. Budgets shows how many active budget thresholds have been crossed. The Cost recommendations panel on the right suggests actions from Databricks itself (Picture 4).
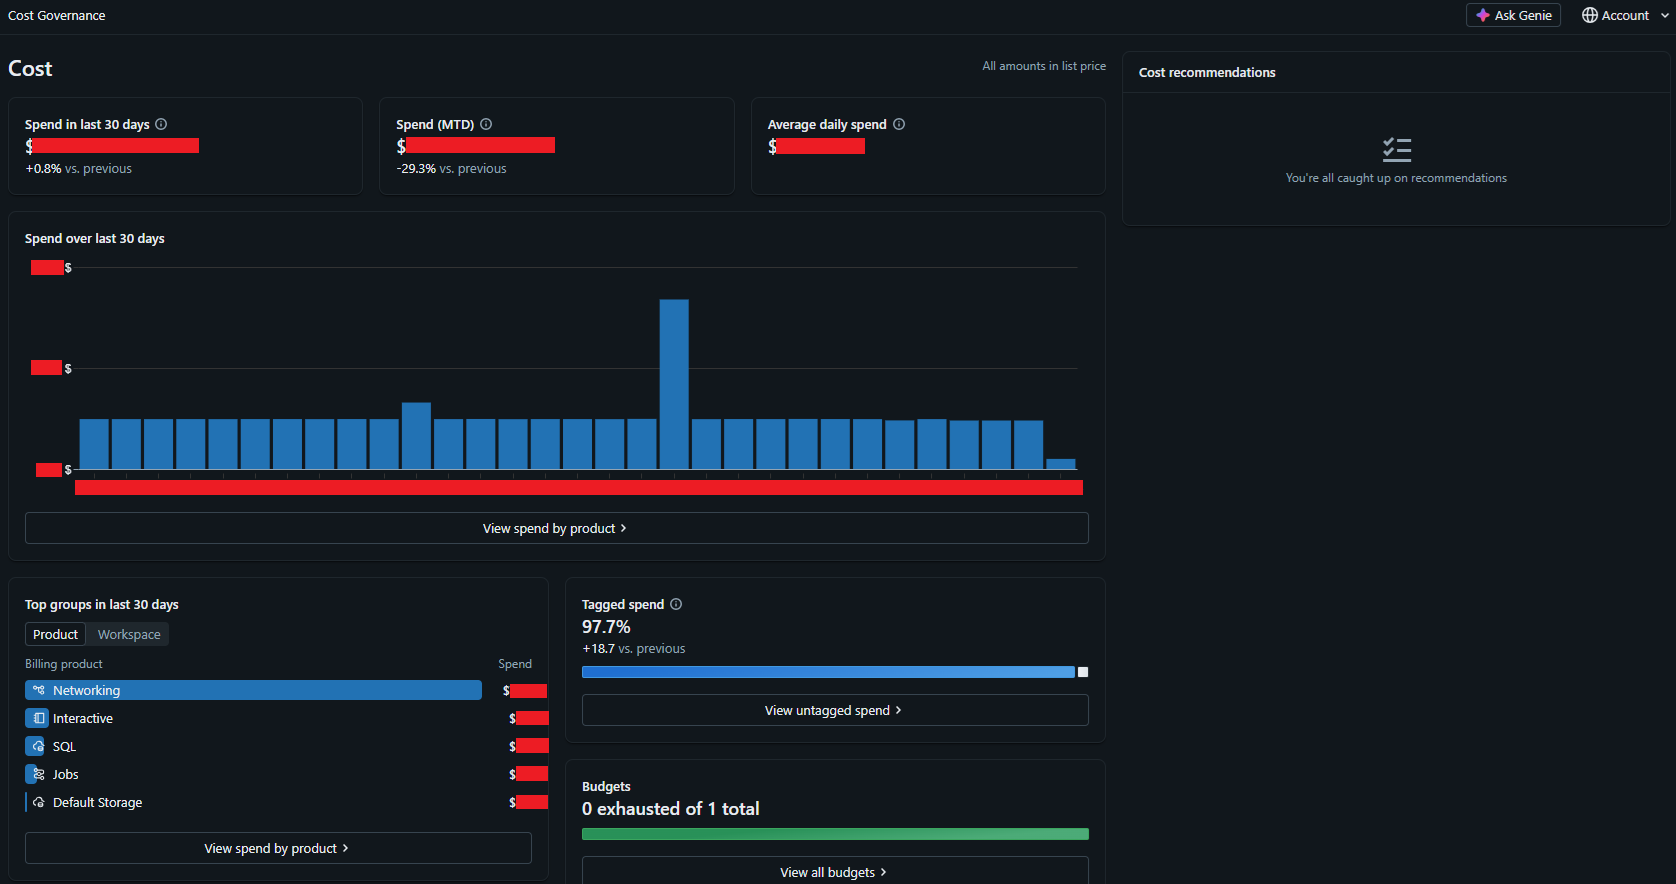
One important boundary: all amounts in Governance Hub are shown at list price, and the view covers only Databricks DBU spend. It does not include the Azure VM, storage, or networking costs on the Azure side of the bill. Governance Hub is a useful complement to the unified FOCUS pipeline, not a replacement.
The bigger architecture
In a full enterprise deployment, this MVP does not float in space. Microsoft’s Cloud Adoption Framework for a unified data platform places it inside a Data Landing Zone (DLZ), the environment hosting the Databricks workspaces and storage, governed by a central Data Management Landing Zone (DMLZ) that provides tenant-wide services such as the data catalog. Identity is another of those tenant-wide services, and one we have already written about: the RS-DataPlatform project concept describes the sovereign identity core that platforms like this one plug into.
We deliberately stop here. The networking, governance, and Terraform design of these landing zones deserves its own post, and it is coming: Part 2 will publish a complete architectural blueprint built on the open-source data management zone and data landing zone Terraform modules.
Conclusion
The pattern described here is not theoretical. A published FinOps case study following the same discipline reports a 70% reduction in idle All-Purpose compute and over $2.1M in annual savings from re-architecting high-frequency jobs, savings that only became visible once cost data was standardized and workload-level visibility was in place.
The honest limitations: the MVP works at daily grain, needs an unmatched-cost bucket for untagged resources, and the Databricks-to-FOCUS mapping is your code to maintain until Databricks ships native FOCUS exports. None of that changes the conclusion. If your team still reconciles Azure and Databricks invoices in a spreadsheet, you already own every tool needed to stop: an Azure subscription, a Databricks workspace, and one scheduled pipeline. Build the MVP, point a dashboard at it, and spend next month’s reconciliation time on optimization instead.
FAQ
Does Azure Databricks export FOCUS data natively?
Only on the Azure side. Azure Cost Management can schedule native FOCUS-format exports of infrastructure costs to
ADLS Gen2, but Databricks DBU consumption lives in system tables (system.billing.usage and
system.billing.list_prices) that do not conform to FOCUS. You close the gap with a scheduled SQL transformation;
the Databricks-published FOCUS 1.3 query is a solid starting point.
How do you join Azure billing data with Databricks DBU usage?
Through tags. Azure Databricks injects ClusterId and WorkspaceId tags into every VM it provisions, so the
pipeline parses the Tags column of the Azure billing stream and matches those values against
usage_metadata.cluster_id in the Databricks system tables. Keep an unmatched-cost bucket for resources created
outside the Databricks control plane, because they carry no such tags.
Why do serverless Databricks costs get double-counted?
Because the serverless DBU price already includes the underlying VM compute. If the pipeline matches Azure infrastructure rows to a serverless workload and adds them to its DBU cost, the same hardware is billed twice. The ETL must branch on billing origin: add infrastructure costs for classic compute only, and treat the DBU cost as complete for serverless workloads.
How do you handle retroactive Azure billing restatements?
With idempotent upserts. Hyperscalers reprocess billing data throughout the month, so the pipeline applies every
refresh with Delta Lake MERGE INTO, keyed on ChargePeriodStart, ResourceId, and SkuId. Matched rows are
updated, new rows inserted, and duplicates never accumulate. Delta time travel preserves the audit trail of what
changed and when.